Price gouging or economics at work: Price intelligence to track consumer sentiment
As the COVID-19 pandemic took hold, we at Zyte (formally Scrapinghub) began to wonder how it would impact the data we crawl, and whether that data could tell us something useful about the pandemic and its impact.
Retail price intelligence is one of our key areas of interest. On a daily basis, we crawl thousands of eCommerce sites for price and stock level information. What insights might be hidden in that data?
To explore this, we identified a basket of goods related to pandemic preparedness (eg Face Masks, medications, etc) and began to track the number of individual items available online in this set, and the average item price over time.

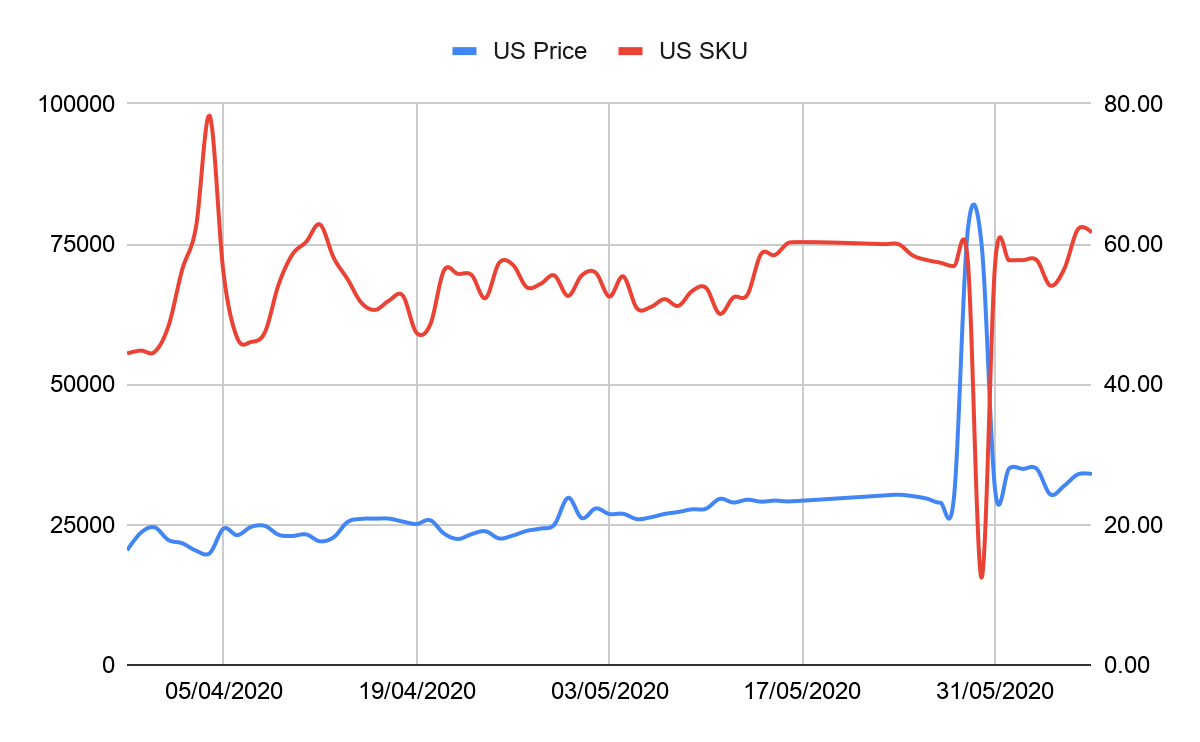
In the first chart, you can see the overall price (in blue), and the number of individual items (SKU’s, in retail parlance, in red) over time for a collection of US data sources. You can see there is a lot of variation in the number of items on supply as new vendors enter the market with basic items. As you might expect, the price often moves in the opposite direction, as in the dip around April 5th. Basic economics works, but the average price doesn’t drop away as strongly as you might expect. Underlying demand is clearly strong. Note that we aren’t looking at stock levels here, just the range of items in stock and available for purchase. Variation in the number of items available could be due to opportunistic vendors entering the market, or rebranding routine supplies with COVID-19 related keywords.
The strength of the underlying demand is such that the overall average price on the basket increased over 40% from March 29th (when we began to track the series) onwards over two months to May 28th. COVID-19 case counts in the US began to lift off in Mid-March, and with media coverage leading that we would expect the ‘normal’ basket price had already risen considerably from its pre-COVID-19 base when we began to track the data.
.png)
The interactive map shows the % increase in the average item cost between 1st April and 1st June 2020. You can see that even in a homogeneous market like the US, there is a considerable state by state variation in the amount of price increases, with prices more than doubling in some states (Alabama, Wyoming) but showing very modest increases in others (Minnesota). The increases do not seem to correlate with actual observed COVID-19 case levels.

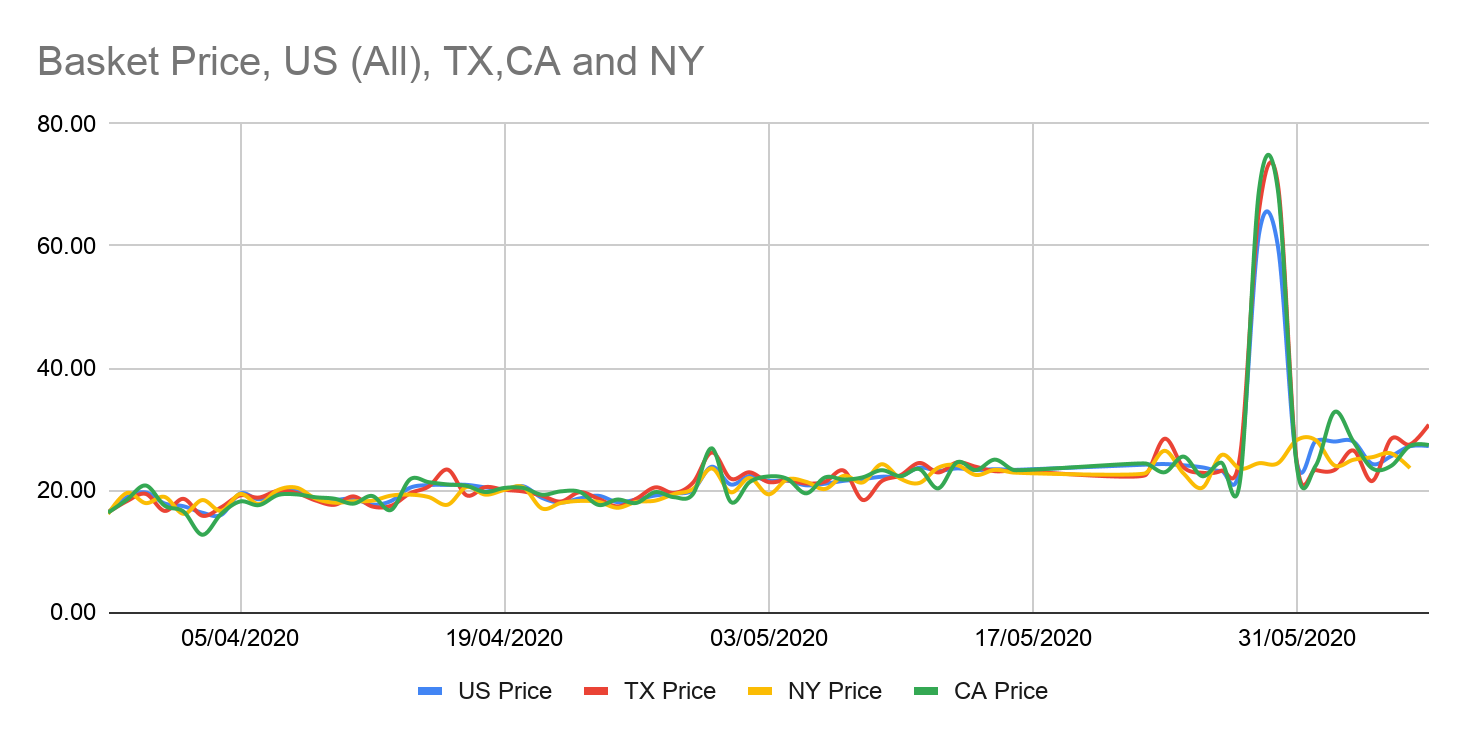
The second chart shows the price, overall, and 3 US states, for comparison. You can see the price ‘wobbles’ quite a lot, often with different states not quite in sync. We expected to see lower prices in states with less active cases, but that doesn’t seem to be the case at all, as the fluid US internal market smooths out price variation within a few days, and thus no systematic variation in price.
In late May, something peculiar happened, causing the base price to shoot right up. It’s early to tell, but it appears that the number of items available fell away quite quickly in recent days, with items at lower price points becoming simply unavailable. Thus the average item price shot up to nearly $70 as only high-priced items were left in stock. We observe this effect varied regionally, with some states, like New York, having little or no impact, and others showing a price spike without much reduction in supply. We hypothesize this may be due to the recent protests and civil disorder in the US affecting supply chains in interesting ways taking certain goods out of supply in certain regions for a few days and triggering a short price shock.
This reminds us how retail price intelligence data, combined with stock level data and delivery wait times, can give a deep insight into supply chain vulnerabilities if you know the right questions to ask. Price Intelligence data can be used for purposes not directly connected to simply setting competitive pricing. Economists tell us price is always a signal, and our data is rich in these signals if we know where to look for them, and can interpret them correctly.
If you are interested in extracting COVID-19 related data for research purposes, we can offer our services for free through our CSR program.
If you are interested in price intelligence data and what data we could provide to help inform your business decisions, download sample data, or get in touch with us.
