How to debug your Scrapy spiders
Welcome to Scrapy Tips from the Pros! Every month we release a few tricks and hacks to help speed up your web scraping and data extraction activities. As the lead Scrapy maintainers, we have run into every obstacle you can imagine so don’t worry, you’re in great hands. Feel free to reach out to us on Twitter or Facebook with suggestions for future topics.
Your spider isn’t working and you have no idea why. One way to quickly spot potential issues is to add a few print statements to find out what's happening. This is often my first step and sometimes all I need to do to uncover the bugs that are preventing my spider from running properly. If this method works for you, great, but if it’s not enough, then read on to learn about how to deal with the nastier bugs that require a more thorough investigation. In this post, I’ll introduce you to the tools that should be in the toolbelt of every Scrapy user when it comes to debugging spiders.
Scrapy Shell is your Best Friend
Scrapy shell is a full-featured Python shell loaded with the same context that you would get in your spider callback methods. You just have to provide an URL and Scrapy Shell will let you interact with the same objects that your spider handles in its callbacks, including the response object.
Plain text
Copy to clipboard
Open code in new window
EnlighterJS 3 Syntax Highlighter
$ scrapy shell http://blog.scrapinghub.com
[s] Available Scrapy objects:
[s] crawler
[s] item {}
[s] request
[s] response <200 https://blog.scrapinghub.com/>
[s] settings
[s] spider <defaultspider 'default'="" at="" 0x7f06371f3290="">
[s] Useful shortcuts:
[s] shelp() Shell help (print this help)
[s] fetch(req_or_url) Fetch request (or URL) and update local objects
[s] view(response) View response in a browser
>>>
$ scrapy shell http://blog.scrapinghub.com [s] Available Scrapy objects: [s] crawler [s] item {} [s] request [s] response <200 https://blog.scrapinghub.com/> [s] settings [s] spider <defaultspider 'default'="" at="" 0x7f06371f3290=""> [s] Useful shortcuts: [s] shelp() Shell help (print this help) [s] fetch(req_or_url) Fetch request (or URL) and update local objects [s] view(response) View response in a browser >>>
1$ scrapy shell http://blog.scrapinghub.com
2\[s\] Available Scrapy objects:
3\[s\]   crawler
4\[s\]   item       {}
5\[s\]   request
6\[s\]   response   <200 https://blog.scrapinghub.com/>
7\[s\]   settings
8\[s\]   spider     <defaultspider 'default'="" at="" 0x7f06371f3290="">
9\[s\] Useful shortcuts:
10\[s\]   shelp()           Shell help (print this help)
11\[s\]   fetch(req\_or\_url) Fetch request (or URL) and update local objects
12\[s\]   view(response)    View response in a browser
13>>>After loading it, you can start playing around with the response in order to build the selectors to extract the data that you need:
Plain text
Copy to clipboard
Open code in new window
EnlighterJS 3 Syntax Highlighter
>>> response.css("div.post-header > h2 ::text").extract()
...
>>> response.css("div.post-header > h2 ::text").extract() ...
1\>>> response.css("div.post-header > h2 ::text").extract()
2...If you're not familiar with Scrapy Shell, give it a try. It's a perfect fit for your development workflow, sitting right after the page inspection in the browser. You can create and test your spider's extraction rules and use them in your spider's code once you've built the ones you need.
Learn more about Scrapy Shell through the official documentation.
Start Scrapy Shell from your Spider Code
If your spider has been behaving unexpectedly for certain responses, you can quickly see what's happening using the scrapy.shell.inspect_response method in your spider code. This will open a Scrapy shell session that will let you interact with the current response object.
For example, imagine that your spider is not extracting the expected amount of items from certain pages and you want to see what's wrong with the response returned by the website:
Plain text
Copy to clipboard
Open code in new window
EnlighterJS 3 Syntax Highlighter
from scrapy.shell import inspect_response
def BlogSpider(scrapy.Spider)
...
def parse(self, response):
if len(response.css('div.post-header > h2 ::text')) > EXPECTED:
# generate the items
else:
inspect_response(response, self)
...
from scrapy.shell import inspect_response def BlogSpider(scrapy.Spider) ... def parse(self, response): if len(response.css('div.post-header > h2 ::text')) > EXPECTED: # generate the items else: inspect_response(response, self) ...
1from scrapy.shell import inspect\_response
2
3def BlogSpider(scrapy.Spider)
4    ...
5    def parse(self, response):
6        if len(response.css('div.post-header > h2 ::text')) > EXPECTED:
7            # generate the items
8        else:
9            inspect\_response(response, self)
10 ...Once the execution hits the inspect_response call, Scrapy Shell is opened and you can interact with the response to see what's happening.
Quickly Attaching a Debugger to your Spider
Another approach to debugging spiders is to use a regular Python debugger such as pdb or PuDB. I use PuDB because it's quite a powerful yet easy-to-use debugger and all I need to do to activate it is to put this code in the line where I want a breakpoint:
1import pudb; pudb.set\_trace()
2
3`import pudb; pudb.set_trace()`And when the breakpoint is reached, PuDB opens up a cool text-mode UI in your terminal that will bring back fond memories from the old days of using the Turbo Pascal debugger.
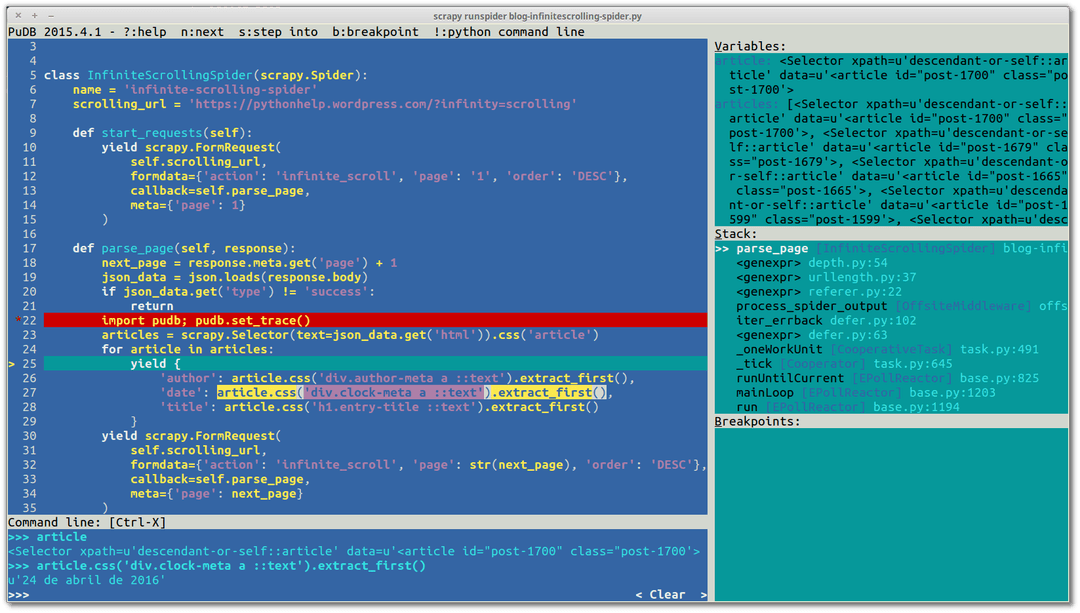
Take a look:
You can install PuDB using pip:
1$ pip install pudb
2
3`$ pip install pudb`Scrapy parse CLI command
There are certain scraping projects where you need your spiders to run for a long time. However, after a few hours of running, you might sadly see in the logs that one of your spiders had issues scraping specific URLs. You want to debug the spider, but you certainly don’t want to run the whole crawling process again and have to wait until that specific callback is called for that specific URL so that you can start your debugger.
Don't worry, the parse command from Scrapy CLI is here to save the day! You just need to provide the spider name, the callback from the spider that should be used and the URL that you want to parse:
1$ scrapy parse http://blog.scrapinghub.com/comments/bla --spider blog -c parse\_commentsIn this case, Scrapy is going to call the parse_comments method from the blog spider to parse the blog.scrapinghub.com/comments/bla URL. If you don't specify the spider, Scrapy will search for a spider capable of handling this URL in your project based on the spiders' allowed_domains settings.
It will then show you a summary of your callback's execution:
Plain text
Copy to clipboard
Open code in new window
EnlighterJS 3 Syntax Highlighter
>>> STATUS DEPTH LEVEL 1 <<<
# Scraped Items ------------------------------------------------------------
[{'comments': [
{'content': u"I've seen this language ...",
'username': u'forthemostpart'},
{'content': u"It's a ...",
'username': u'YellowAfterlife'},
...
{'content': u"There is a macro for ...",
'username': u'mrcdk'}]}]
# Requests -----------------------------------------------------------------
[]
>>> STATUS DEPTH LEVEL 1 <<< # Scraped Items ------------------------------------------------------------ [{'comments': [ {'content': u"I've seen this language ...", 'username': u'forthemostpart'}, {'content': u"It's a ...", 'username': u'YellowAfterlife'}, ... {'content': u"There is a macro for ...", 'username': u'mrcdk'}]}] # Requests ----------------------------------------------------------------- []
1\>>> STATUS DEPTH LEVEL 1 <<<
2# Scraped Items  ------------------------------------------------------------
3\[{'comments': \[
4    {'content': u"I've seen this language ...",
5     'username': u'forthemostpart'},
6    {'content': u"It's a ...",
7     'username': u'YellowAfterlife'},
8    ...
9    {'content': u"There is a macro for ...",
10    'username': u'mrcdk'}\]}\]
11# Requests  -----------------------------------------------------------------
12\[\]You can also attach a debugger inside the method to help you figure out what's happening (see the previous tip).
Scrapy fetch and view commands
Inspecting page contents in browsers might be deceiving since their JavaScript engine could render some content that the Scrapy downloader will not do. If you want to quickly check exactly how a page will look when downloaded by Scrapy, you can use these commands:
- fetch: downloads the HTML using Scrapy Downloader and prints to stdout.
- view: downloads the HTML using Scrapy Downloader and opens it with your default browser.
Examples:
1$ scrapy fetch http://blog.scrapinghub.com > blog.html
2$ scrapy view http://scrapy.orgPost-Mortem Debugging Over Spiders with ---pdb Option
Writing fail-proof software is nearly impossible. This situation is worse for web scrapers since they deal with web content that is frequently changing (and breaking). It's better to accept that our spiders will eventually fail and to make sure that we have the tools to quickly understand why it's broken and to be able to fix it as soon as possible.
Python tracebacks are great, but in some cases they don't provide us with enough information about what happened in our code. This is where post-mortem debugging comes into play. Scrapy provides the --pdb command line option that fires a pdb session right where your crawler has broken, so you can inspect its context and understand what happened:
1$ scrapy crawl blog -o blog\_items.jl --pdbIf your spider dies due to a fatal exception, the pdb debugger will open and you can thoroughly inspect its cause of death.
Wrap-up
And that’s it for the Scrapy Tips from the Pros May edition.
Some of these debugging tips are also available in Scrapy official documentation.
Please let us know what you'd like to see in the future since we're here to help you scrape the web more effectively.
We'll see you next month!


_HFpro5d6k3.png&w=256&q=75)
_E4PyVpfAxa.png&w=256&q=75)


-(1).png&w=1920&q=75)
-(1)_VZGHqxCgXV.png&w=1920&q=75)
