Data quality is whether the data you collected is fit for the job you collected it for. For web data you check five things (accuracy, completeness, validity, consistency and timeliness), weight them by what your use needs, and track one score over time.
When web data powers your business, every fragment can affect your future.
Often, when companies collect public web data, whether it is for ecommerce monitoring, real estate analytics or more, they measure the success of that task with one simple question: did the process result in any data, or not?
But that question overlooks one key truth: while web data extraction may succeed in yielding output, that output may nevertheless be incomplete, inaccurate or otherwise substandard.
To those who depend on it, good web data is never binary. Imagine a price monitoring project in which a silent glitch turns $109.99 into $10.99. One missed character can generate faulty insights that derail corporate trust, customer usability or forecast revenue.
What is data quality, and where does the idea come from?
A discipline with roots in information systems research from the 1980s and in the quality methods of manufacturing.
Fortunately, the practice of data quality (DQ) is emerging as a key discipline businesses can use to understand and improve the provenance of the content they collect.
Data quality isn't a wholly new concept.
In 1985, Donald Ballou and Harold Pazer mapped four key dimensions of good data. Their paper in Management Science modelled data and process quality in information systems (Ballou and Pazer, Management Science, February 1985), and a 1998 MIT paper on data quality management cites it for four basic measures: accuracy, timeliness, completeness and consistency (Wang, Communications of the ACM, February 1998).
MIT later built on this with its Total Data Quality Management (TDQM) Cycle (define, measure, analyse, improve), borrowed from manufacturing. The same 1998 paper describes the cycle as an adaptation of the Deming cycle of plan, do, check and act from the total quality management literature.
The Data Management Body of Knowledge handbook, published by the industry's data management association DAMA International, is now in its second edition, and DAMA describes it as "the globally recognized framework for data management" (DAMA International).
Today, these frameworks guide everything from traditional data work to modern web data collection.
How is data quality for web data like quality assurance elsewhere?
It is the same move, from asking whether anything was produced to asking whether what was produced passes inspection.
You can think of data quality for web data collection as an expression of quality assurance (QA) broadly.
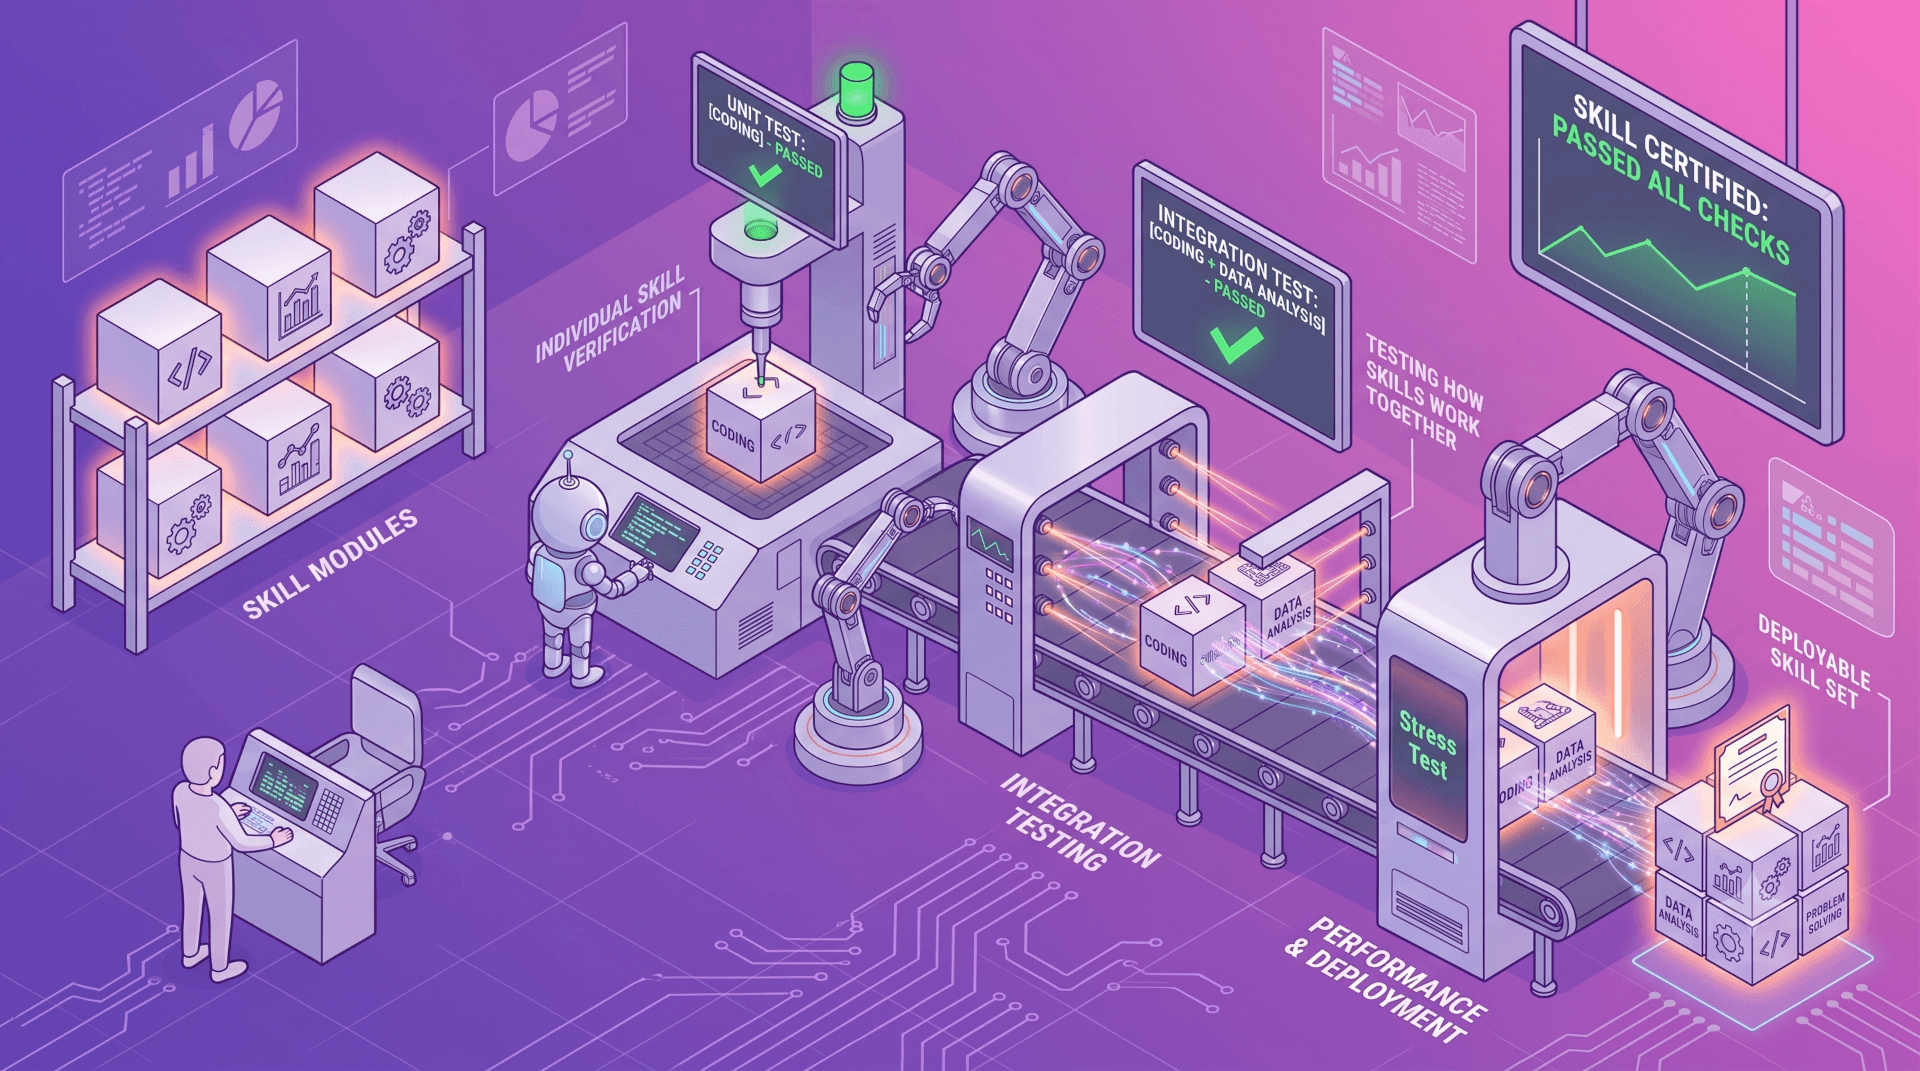
In manufacturing, QA has helped factory managers move from "We built all the cars" to "We built cars that pass a statistical inspection."
In computing, software teams evolved from "It compiles" to "Every build passes thorough unit, integration, and user tests."
Web data teams are now on the same journey: away from simply the task of scraping, toward repeatable, audited data pipelines that achieve desired results with minimal error.
A data quality mindset prioritizes not only data collection itself but ensuring that obtained data is fit for use, the core tenet of the first phase in the TDQM Cycle.
Richard Y. Wang and Diane M. Strong define data quality "as data that are fit for use by data consumers" (Beyond Accuracy, Journal of Management Information Systems, Spring 1996). In the TDQM cycle, the definition step identifies the quality dimensions that matter and the requirements that go with them (Wang, Communications of the ACM, February 1998).
How do you decide what quality means for your project?
Inspect your data routinely, and agree with the people who use it which dimensions matter most.
Key to achieving data quality is routinely inspecting your data. "You don't know your car is broken until it breaks down," says a Zyte QA data scientist. "The further you go without inspecting the data, the harder it bites."
So, give your data engine an inspection every once in a while to make sure it's running effectively.
But what exactly are you inspecting for? In a case study paper on Information Resources, Inc., hosted by MIT's Total Data Quality Management program, Rita Kovac, Yang W. Lee and Leo L. Pipino made the case that each company must choose a definition that is appropriate to its goals, its industry, and its internal culture (Total Data Quality Management: The Case of IRI).
It is important to declare what is, and is not, important to your use case.
Embarking on a data quality odyssey, then, depends on deciding what is important to you and the data you are gathering.
Which five dimensions should you measure?
Accuracy, completeness, validity, consistency and timeliness, each weighted by how much it matters to your use.
How exactly can you decide what constitutes "quality" for your business?
The same data scientist recommends expressing your quality threshold using five data dimensions:
- Accuracy: does the captured value match the value on the page?
- Completeness: do we have all the records and fields we can get?
- Validity: do values conform to agreed-upon formats?
- Consistency: do values stay consistent across records or between extracts?
- Timeliness: is the data delivered in a timely manner to be valuable?
Because each of these dimensions may be more or less critical to you, he says you can define your project's "data quality" by thinking of the criticality of each dimension as though on a sliding scale.
"The sooner you think about something, the less surprised you will be by the outcome," he says.
"Ask yourself: 'What dimensions do we need to focus on? What do we care more about: the timeliness or the consistency? And what are we going to measure as the quality metric? All of that needs to be agreed upon while planning."
What's achievable in data quality is always a product of push, pull, and balance between each of these goals. For example:
- A retail pricing team launching dynamic discounting needs razor-sharp accuracy on price fields every morning, but perfectly-formatted product descriptions may be merely a nice-to-have.
- Product managers studying competitor feature gaps care more about completeness of attribute lists than millisecond-fresh information.
- Executives monitoring market share can tolerate a 24-hour delay, but not landscape gaps that misrepresent their company's share.
The only "right" mix is the one that meets your tolerance for error and delay. So, decide with stakeholders which data fields and which dimensions are mission-critical, and which may be merely desirable.
How do you put data quality into practice?
In five steps: show what good data looks like, write the rules down as a schema, monitor the data as it arrives, collect an indicator for each dimension, and score the result.
Now that you know how to think about DQ, how can you actually implement it in your organization?
How do you show your team what good data looks like?
Give them examples, not only a description.
Just as you must intentionally conceive of what "quality" means to you, it is crucial to communicate your target data needs to your data collection team, clearly and in detail.
"Show" can be more impactful than "tell", so give your team an example of what good data looks like. For instance, provide a spreadsheet of mock records, annotated screenshots, or video walkthroughs of the target pages, to show exactly what data to extract from each layout, as well as how it should be parsed and formatted.
Clearly illustrating your needs in this way leaves your team with absolute clarity, helping avoid mid-project discoveries of substandard results.
How do you write your requirements down as a schema?
In a JSON Schema: a document that lists each field, its type and the values it may take.
Your requirements shouldn't remain in the realm of illustration alone. Data quality is achieved when you actively specify the finer points of your requirements.
Define and document your rules of the road: for example, fields that are required, those which are optional, whether a missing field should be collected as an empty string or omitted entirely, whether currencies should be converted during scraping or later.
The definition of such rules is called a "schema", documenting the structure, data types and value restrictions for your data, and is expressed in a standardized data specification format such as JSON Schema.
The project's own site calls JSON Schema "the vocabulary that enables JSON data consistency, validity, and interoperability at scale" (JSON Schema).
1{
2  "$id": "https://example.com/inventory-item.schema.json",
3  "$schema": "https://json-schema.org/draft/2020-12/schema",
4  "title": "InventoryItem",
5  "type": "object",
6  "properties": {
7    "productName": {
8      "type": "string",
9      "description": "Name of the product.",
10      "minLength": 2,
11      "maxLength": 100
12    },
13    "inStock": {
14      "type": "boolean",
15      "description": "Whether the item is currently in stock."
16    },
17    "quantity": {
18      "type": "integer",
19      "description": "Number of items available in stock.",
20      "minimum": 0,
21      "maximum": 10000
22    },
23    "price": {
24      "type": "number",
25      "description": "Unit price of the product in USD.",
26      "minimum": 0,
27      "maximum": 10000
28    }
29  }
30}In this example, minLength and maxLength constrain the length of a string, and minimum and maximum set the range a number must fall within (Understanding JSON Schema, string; Understanding JSON Schema, numeric types). The $schema line names the 2020-12 version of the specification. The $id uses example.com, a domain reserved for examples.
The example has no required list, so a record that leaves out a field still passes. The JSON Schema reference says: "By default, the properties defined by the properties keyword are not required. However, one can provide a list of required properties using the required keyword." (Understanding JSON Schema, object). Add "required": ["productName", "price"] at the top level for the fields your use cannot do without.
Such a schema articulates the requirements for your output, to data engineers and systems alike, serving as both the map for your data journey and the enforcer for your data project.
How do you monitor data quality while the data flows in?
With monitors: automated checks that run against each job's output and alert someone when a rule fails.
With the specifications in place and web data flowing in, your team can configure different variables and checks to actually monitor for DQ.
In web data extraction, a "monitor" is like a "test case" in software development at large: a set of instructions for ensuring proper functioning.
Teams using Scrapy can add Spidermon, which its documentation describes as "a framework to build monitors for Scrapy spiders" (Spidermon documentation).
Spidermon supports data validation against JSON Schema rules and can trigger alerts based on data collection that breaches rules or even fails.
Its item validation runs your schema against each item the spider returns, through a pipeline you enable in the project, and it needs the jsonschema library installed (Spidermon item validation). Its notifications go out by email, Slack, Telegram and Discord (Spidermon documentation).
Zyte maintains Scrapy (Scrapy), and Spidermon's code is published in the scrapinghub organisation on GitHub (Spidermon repository). How Zyte uses Spidermon is on the Zyte blog.
What signals show the quality of each dimension?
One per dimension, each checked against something outside the data: the page, the site, the schema, earlier extracts, or the delivery schedule.
With monitors in place, what signals actually add up to data quality? Your team can check for quality by testing extracted data against our five dimensions.
Accuracy: validating against the webpage. Does the data being output match the actual content on the target page, or was it spoiled during extraction? Your team can calculate the match rate by running a side-by-side visual comparison of a representative sample of records.
Completeness: validating against the website. Did extraction get all the target records? Overall completeness compares the latest collected record count with the expected number. Field completeness shows how often each field is populated in the collected data. Summary stats of key fields can be reported in the crawl job metadata to make it easier to spot issues.
Validity: validating against the format requirements. Do extracted data fields appear in the correct format? Each field is tested against the rules supplied in your schema to calculate the percentage of rows that conform to the agreed patterns.
Consistency: validating across records. Do values stay consistent across records or between extracts? What if reviews you are extracting move from a five-star system to a 10-point scale? Calculate z-scores, a measure of how far a value is from the mean, for key numeric fields to spot outliers.
The NIST Engineering Statistics Handbook puts it this way: with a z-score, "data is given in units of how many standard deviations it is from the mean". It also warns that using z-scores to flag outliers "can be misleading (particularly for small sample sizes)" (NIST/SEMATECH e-Handbook of Statistical Methods, Detection of Outliers). So compare like with like, and check a flagged value against the page before you treat it as an error.
Timeliness: validating against the schedule. Is the data delivered in a timely manner to be valuable? The recorded delivery completion timestamp is compared to the target delivery time. Calculate the current job's completion status, on time or not, against a number of total deliveries so far to get a percentage success rate.
By testing the indicators inherent in your data against these yardsticks, you can begin to get a real sense for your data's provenance.
How do you turn the indicators into one score?
Weight each dimension by how much it matters to you, then take the weighted average of the five scores.
What separates a one-off quality inspection from a systemic commitment to improving data quality is ongoing measurement and the refinement it enables.
Many people have a gut sense that they know "quality" when they see it. But what gets measured gets managed.
Gartner's data quality page says its surveys found that 59% of organizations do not measure data quality, and it puts the cost of poor data quality at $12.9 million a year or more on average, from Gartner research in 2020 (Gartner, Data Quality: Why It Matters and How to Achieve It).
MIT's TDQM Cycle recommends you "develop a set of metrics that measure the important dimensions of data quality for the organization and that can be linked to the organization's general goals and objectives" (Total Data Quality Management: The Case of IRI).
There is no single, universally agreed-upon score for data quality across all industries. But, having monitored to obtain the key indicators above, you can create a simple weighted average to your overall data quality.
| Dimension | How to calculate it |
|---|---|
| Accuracy | (correct values ÷ values checked) × 100% |
| Completeness | Records: (records collected ÷ records expected) × 100%. Fields: (populated fields ÷ expected fields) × 100% |
| Validity | (records passing the rule set ÷ total records) × 100% |
| Consistency | (consistent records ÷ total records) × 100% |
| Timeliness | (on-time deliveries ÷ total deliveries) × 100% |
The overall score is the weighted average of the five:
Overall DQ score = (w1 × S1 + w2 × S2 + w3 × S3 + w4 × S4 + w5 × S5) ÷ (w1 + w2 + w3 + w4 + w5)
Each S is one dimension's score as a percentage, and each w is the weight your team gave that dimension when it decided what matters most. If the five weights add up to 1, the divisor is 1 and the overall score is the sum of each weight times its score. Choose one completeness measure, records or fields, for the overall score, and report the other beside it.
By adding together the weight-adjusted individual scores, you can generate a highly useful DQ rating for each of your data's five dimensions, a method that can be applied to every extraction and graphed on an ongoing basis.
By combining these component scores, you can produce a highly impactful top-line DQ score for your entire pipeline.
It is also easy to see how banding your main DQ score by numeric range can create a colour-coded health indicator for your entire data pipeline, green, amber and red at thresholds your team agrees, displayable in a status dashboard to your entire team.
By publishing both the aggregate and underlying metrics, it becomes easy to identify which dimension may be causing slippage that impacts overall data quality.
What does measured data quality change for the business?
Confidence in the data, and a way to show stakeholders what that data now supports.
Web data quality is never as simple as an on-off switch. It's more like a slider. But you can control that slider.
When scraping operations are run through the lens of "data quality" practices (some old, some novel), the pay-off is immediate confidence.
Let knowledge and evidence of your data quality drive the next conversation with your stakeholders: "Here's the quality level we've reached, the business decisions it now supports, and the competitive upside we've unlocked as a result." Establish feedback loops to adjust weights, refine expected deliverables, or expand the schema as your market questions evolve.
The organizations that win the next pricing war or product race won't be the ones who collected the most data; they'll be the ones who proved their data was worth acting on.
Where does data quality fit in the rest of your pipeline?
Between collecting the data and using it.
Storing and curating web data covers what happens after the checks: how the data reaches a database and how tables are split. Data extraction tools covers the tools that collect and parse it in the first place. For the dimensions in more depth, Zyte's overview of web data quality assurance is a recorded webinar on the same five.
FAQ
Q: What are the five dimensions of web data quality?
A: Five questions you ask of every extract:
- Accuracy: does each value match the value on the page?
- Completeness: did you get all the records and fields you expected?
- Validity: does each value follow the format your schema sets?
- Consistency: do values stay consistent across records and between extracts?
- Timeliness: did the data arrive when it was needed?
Q: How do you calculate an overall data quality score for web data?
A: Multiply each dimension's score by the weight your team gave it, add the five results, and divide by the sum of the weights. If the weights add up to 1, the division changes nothing. Track the score on every extraction so a drop shows up as a trend, and publish the five dimension scores beside it so you can see which one moved.
Q: How do you check the accuracy of scraped data?
A: Take a representative sample of records and compare each value side by side with the live page it came from. The accuracy score is the number of correct values divided by the number of values checked, as a percentage.
Q: What is the difference between record completeness and field completeness?
A: Record completeness compares how many records you collected with how many you expected. Field completeness shows how often each field is populated across the records you did collect. A job can score well on one and badly on the other, so report both.
Q: Can Spidermon check scraped items against a JSON Schema?
A: Yes. Spidermon's item validation runs a schema against each item a Scrapy spider returns, through a pipeline you enable in the project, and it needs the jsonschema library installed. It can then alert you by email, Slack, Telegram or Discord when a monitor fails.
Q: How do you notice when a site changes how it formats a value, such as a rating scale?
A: Check consistency across extracts. Calculate z-scores for key numeric fields, so a value that sits many standard deviations from the mean stands out, then check the flagged values against the page. A move from a five-star scale to a ten-point scale shows up this way.
Q: Is there one data quality score that every industry uses?
A: No. There is no universally agreed score. Each team chooses the dimensions and weights that fit its own use, and the weighted average is a method, not a standard.
Q: How much does poor data quality cost a business?
A: Gartner's data quality page puts it at $12.9 million a year or more on average, from Gartner research in 2020, and says its surveys found that 59% of organizations do not measure data quality at all.