
A practical guide to web data extraction QA part II: Common validation pitfalls
In case you missed the first part of this series, where we went through data validation techniques, you can read it now: A practical guide to web data extraction QA part I: Validation techniques
When you extract data from the web at scale, quality assurance is an important process to make sure your web extracted data is consistently high quality.
Validation of this data can be complex though. There are many challenges and problems that need to be addressed.
In the second part of this series on web data quality assurance, we will cover the most common hurdles and pitfalls in data validation and how to deal with them.
I still remember my first lesson when I joined the team. My manager shared 3 simple questions to keep in our mind working on data validation:
- Did we scrape the right thing?
- Did we miss anything?
- Did we scrape the same thing multiple times?
The problems will be listed in their natural appearance in a typical web scraping project.
Misunderstanding of requirements
In the previous post, we discussed the importance of clear, testable requirements. Now let's add more details about what else could be challenging at this point.
Ask the right questions
The QA department is responsible for defining good tests, both in terms of quality and in terms of quantity. Usually, questions like the following are asked:
- Do we need this data?
- Do we need to collect products without price, not available or expired?
- What should be done in case of duplication?
- If an item is available in several categories - should we collect all of them? Or only one? If the latter, then which one?
- Is data complete? If not, what is missing?
- Are all categories and places present? If not, what percentage is missing? Is it in scope or not?
- Do requirements meet the reality?
- Requirements might expect e.g. 100 records when in reality only 10 are available.

Complex data
There are a lot of different kinds of data on the internet. How do you deal with unfamiliar language or structure? Validation is tricky enough in one’s own language. But what can you do when you need to compare two items in Japanese, for example? Let's check one example:
Can you visually spot the differences between old and new data? If you speak Japanese, you probably can. You will recognize these as the numbers 1 to 10. If you don’t speak Japanese, then visual validation is going to be much more difficult.
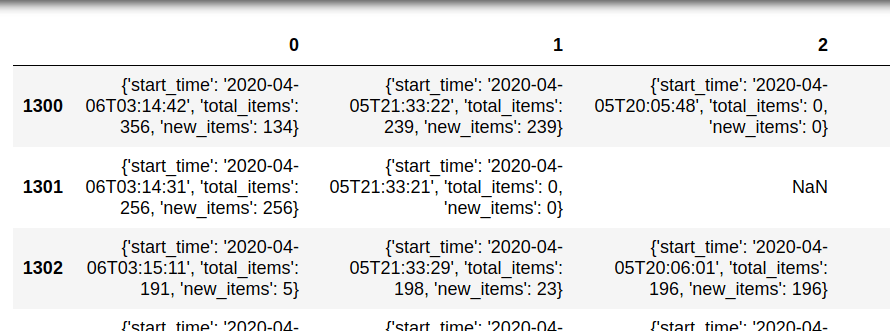
Another example of complex data is a situation where the data is stored as a nested structure in a single column. This usually happens for data like promotions, variants, options, or features.
Here’s an example showing a single column that contains 3 nested fields: start_time, total_items, and new_items. Working with nested fields requires additional steps.
Plain text
Copy to clipboard
Open code in new window
EnlighterJS 3 Syntax Highlighter
[ { "start_time": "2020-04-06T04:16:57", "total_items": 480, "new_items": 480 }, { "start_time": "2020-04-05T22:47:23", "total_items": 0, "new_items": 0 } ]
[ { "start_time": "2020-04-06T04:16:57", "total_items": 480, "new_items": 480 }, { "start_time": "2020-04-05T22:47:23", "total_items": 0, "new_items": 0 } ]
1\[ { "start\_time": "2020-04-06T04:16:57", "total\_items": 480, "new\_items": 480 }, { "start\_time": "2020-04-05T22:47:23", "total\_items": 0, "new\_items": 0 } \]What if we need to extract the maximum price per product? The first step is to extract nested data:
Plain text
Copy to clipboard
Open code in new window
EnlighterJS 3 Syntax Highlighter
df['promotion'].apply(pd.Series)
df['promotion'].apply(pd.Series)
1df\['promotion'\].apply(pd.Series)this will result in:
- We need to expand this data again (depending on the nested levels):
Plain text
Copy to clipboard
Open code in new window
EnlighterJS 3 Syntax Highlighter
[ { "start_time": "2020-04-06T04:16:57", "total_items": 480, "new_items": 480 }, { "start_time": "2020-04-05T22:47:23", "total_items": 0, "new_items": 0 } ]
[ { "start_time": "2020-04-06T04:16:57", "total_items": 480, "new_items": 480 }, { "start_time": "2020-04-05T22:47:23", "total_items": 0, "new_items": 0 } ]
1\[ { "start\_time": "2020-04-06T04:16:57", "total\_items": 480, "new\_items": 480 }, { "start\_time": "2020-04-05T22:47:23", "total\_items": 0, "new\_items": 0 } \]- Then we apply a merge:
Plain text
Copy to clipboard
Open code in new window
EnlighterJS 3 Syntax Highlighter
df_items11 = pd.merge(df_items, df_items1, left_index=True, right_index=True, suffixes=('-xx', '_1'))
df_items11 = pd.merge(df_items, df_items1, left_index=True, right_index=True, suffixes=('-xx', '_1'))
1df\_items11 = pd.merge(df\_items, df\_items1, left\_index=True, right\_index=True, suffixes=('-xx', '\_1'))- Once all data is expanded we can get max values from the columns of interest:
Plain text
Copy to clipboard
Open code in new window
EnlighterJS 3 Syntax Highlighter
df_items33['max'] = df_items33[['new_items0', 'new_items', 'new_items_2', 'new_items_3']].fillna(0).values.max(axis=1)
df_items33['max'] = df_items33[['new_items0', 'new_items', 'new_items_2', 'new_items_3']].fillna(0).values.max(axis=1)
1df\_items33\['max'\] = df\_items33\[\['new\_items0', 'new\_items', 'new\_items\_2', 'new\_items\_3'\]\].fillna(0).values.max(axis=1)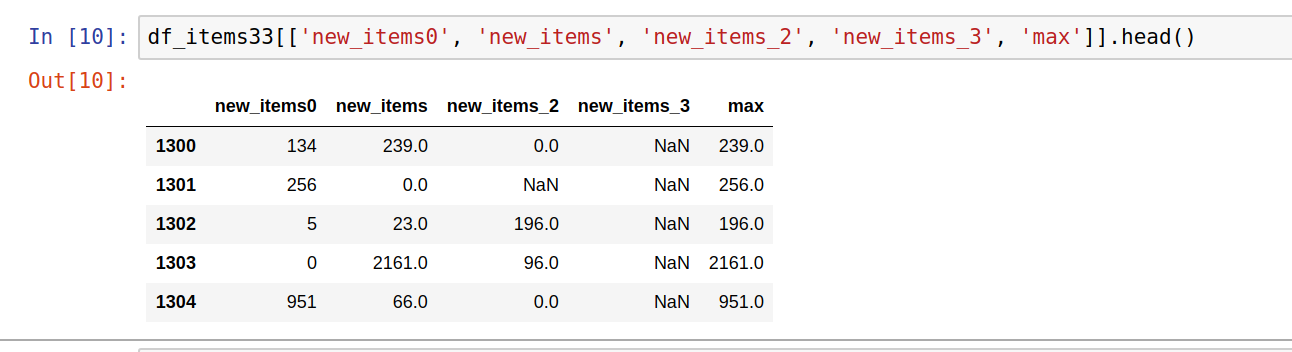
Data comparison
Data comparison is essential for regression tests - in this case, two or more datasets of scraped data for the same spider need to be compared with each other. Data comparison can be done on individual or multiple items. Let's illustrate both with examples:
Individual item comparison
By combining Pandas with NumPy, individual items can be compared using the following techniques. First, we will merge the items for comparison.
Plain text
Copy to clipboard
Open code in new window
EnlighterJS 3 Syntax Highlighter
import pandas as pd df_all = pd.concat([df, df1], axis='columns')
import pandas as pd df_all = pd.concat([df, df1], axis='columns')
1import pandas as pd df\_all = pd.concat(\[df, df1\], axis='columns')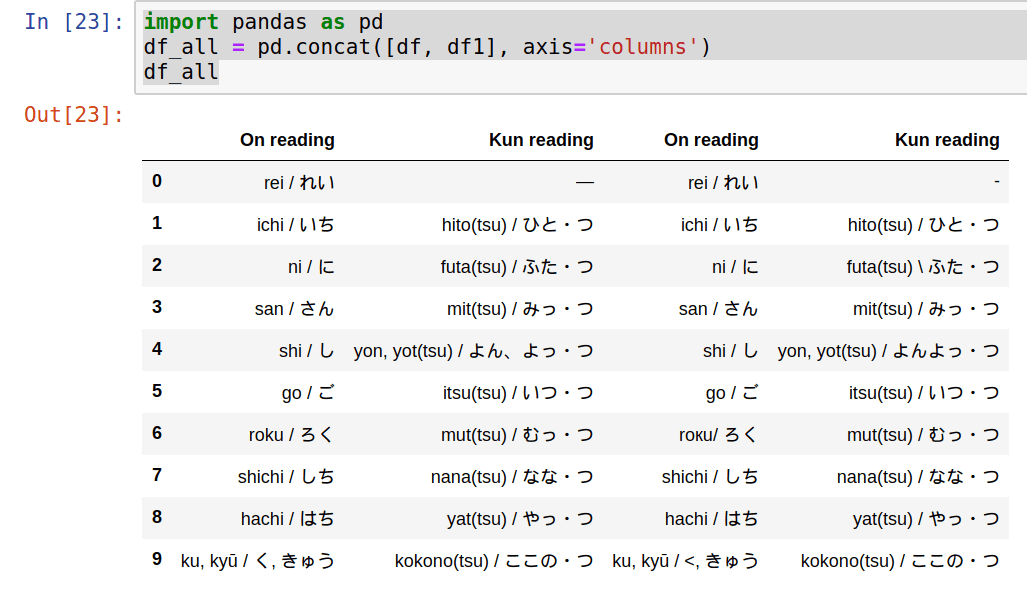
Note: Items can be merged in different ways depending on the requirements:
- .merge()
- .concat()
- pd.DataFrame.join()
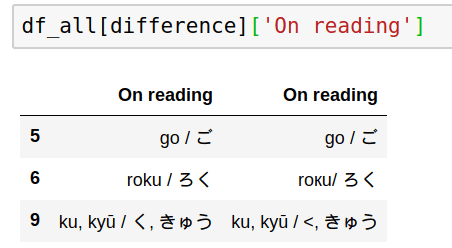
The next step is to identify which items differ between the two datasets:
Plain text
Copy to clipboard
Open code in new window
EnlighterJS 3 Syntax Highlighter
import numpy as np difference = np.where(df['On reading'] != df1['On reading'], True, False) df_all[difference]['On reading']
import numpy as np difference = np.where(df['On reading'] != df1['On reading'], True, False) df_all[difference]['On reading']
1import numpy as np difference = np.where(df\['On reading'\] != df1\['On reading'\], True, False) df\_all\[difference\]\['On reading'\]Finally, we will read the different values with:
Comparison can be done for more than one column:
Plain text
Copy to clipboard
Open code in new window
EnlighterJS 3 Syntax Highlighter
import numpy as np difference = np.where((df['Kun reading'] != df1['Kun reading']) | (df['On reading'] != df1['On reading']), True, False)
import numpy as np difference = np.where((df['Kun reading'] != df1['Kun reading']) | (df['On reading'] != df1['On reading']), True, False)
1import numpy as np difference = np.where((df\['Kun reading'\] != df1\['Kun reading'\]) | (df\['On reading'\] != df1\['On reading'\]), True, False)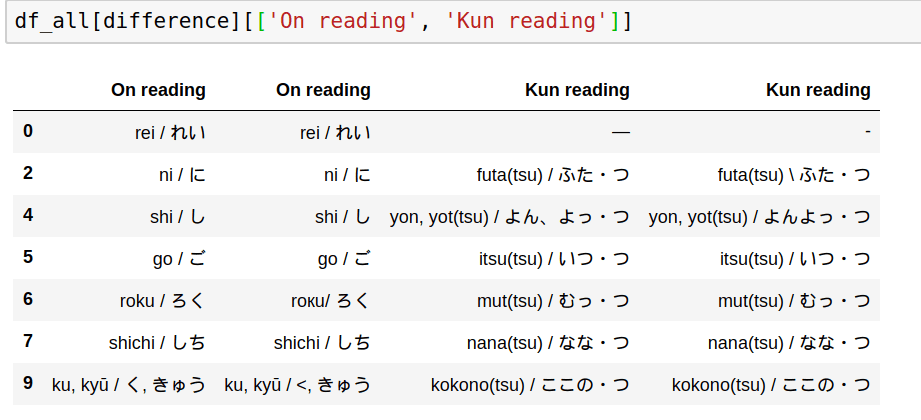
Still hard to find the differences? Then let’s go one step further by highlighting differences. Remember that two things can be similar or look the same but they can still be different(browsers hide extra trailing spaces) - this will impact stats and reports.
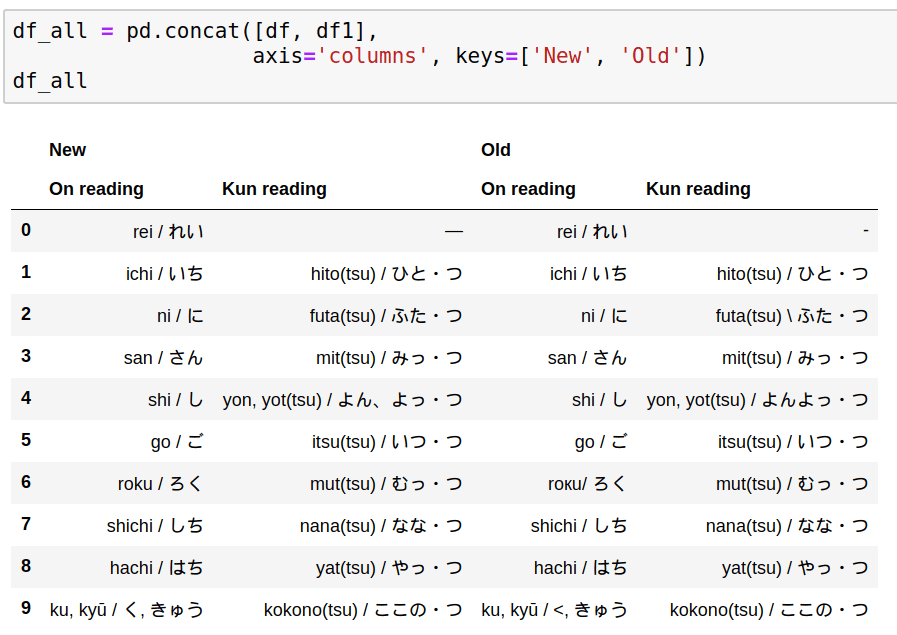
Comparison with highlight: custom highlighting can be applied for comparison by defining a method and applying it on the comparison like:
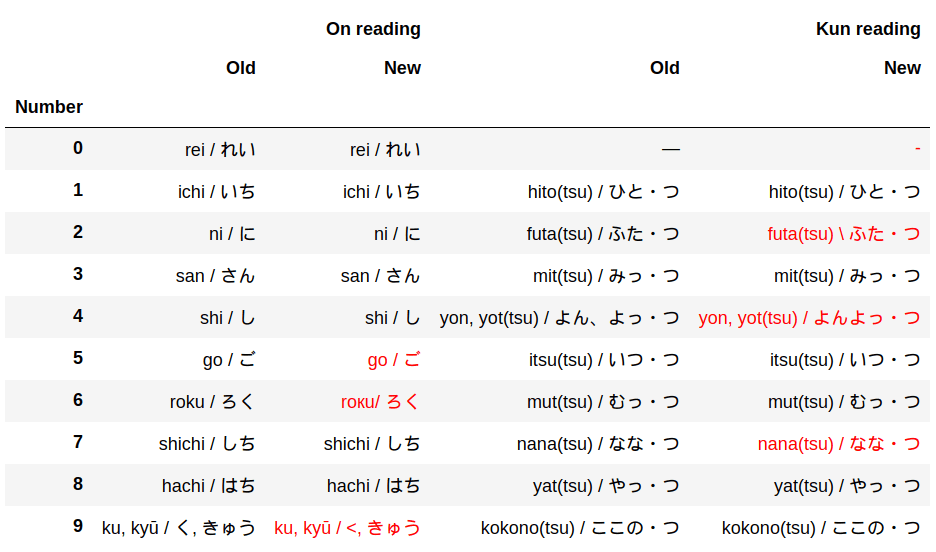
This can be achieved in several ways. First, you need to concatenate DataFrames:
Plain text
Copy to clipboard
Open code in new window
EnlighterJS 3 Syntax Highlighter
df_concat = pd.concat( [df.set_index('Number'), df1.set_index('Number')], axis="columns", keys=["Old", "New"] )
df_concat = pd.concat( [df.set_index('Number'), df1.set_index('Number')], axis="columns", keys=["Old", "New"] )
1df\_concat = pd.concat( \[df.set\_index('Number'), df1.set\_index('Number')\], axis="columns", keys=\["Old", "New"\] )The next step is to swap the multi-index levels:
Plain text
Copy to clipboard
Open code in new window
EnlighterJS 3 Syntax Highlighter
df_diff = df_concat.swaplevel(axis='columns')[df.columns[:2]]
df_diff = df_concat.swaplevel(axis='columns')[df.columns[:2]]
1df\_diff = df\_concat.swaplevel(axis='columns')\[df.columns\[:2\]\]Finally, define a method for highlighting the differences and apply it to the concatenated data:
Plain text
Copy to clipboard
Open code in new window
EnlighterJS 3 Syntax Highlighter
import numpy as np def highlight(data, color='red'): attr = 'color: {}'.format(color) other = data.xs('Old', axis='columns', level=-1) return pd.DataFrame(np.where(data.ne(other, level=0), attr, ''), index=data.index, columns=data.columns) df_final.style.apply(highlight_diff, axis=None)
import numpy as np def highlight(data, color='red'): attr = 'color: {}'.format(color) other = data.xs('Old', axis='columns', level=-1) return pd.DataFrame(np.where(data.ne(other, level=0), attr, ''), index=data.index, columns=data.columns) df_final.style.apply(highlight_diff, axis=None)
1import numpy as np def highlight(data, color='red'): attr = 'color: {}'.format(color) other = data.xs('Old', axis='columns', level=-1) return pd.DataFrame(np.where(data.ne(other, level=0), attr, ''), index=data.index, columns=data.columns) df\_final.style.apply(highlight\_diff, axis=None)Compare all items in the dataset
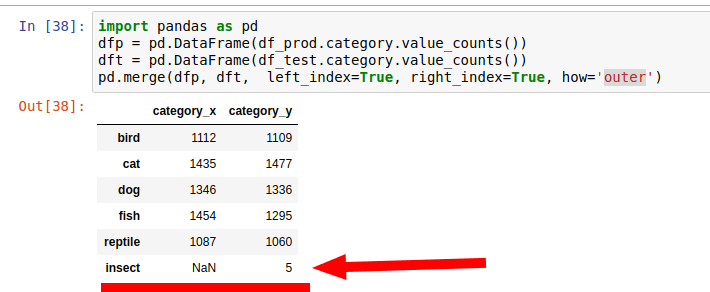
In order to validate two datasets against one another, we need to select appropriate criteria. Normally this is done by taking categorical data and checking counts on both datasets side by side.
Plain text
Copy to clipboard
Open code in new window
EnlighterJS 3 Syntax Highlighter
import pandas as pd dfp = pd.DataFrame(df_prod.category.value_counts()) dft = pd.DataFrame(df_test.category.value_counts()) pd.merge(dfp, dft, left_index=True, right_index=True)
import pandas as pd dfp = pd.DataFrame(df_prod.category.value_counts()) dft = pd.DataFrame(df_test.category.value_counts()) pd.merge(dfp, dft, left_index=True, right_index=True)
1import pandas as pd dfp = pd.DataFrame(df\_prod.category.value\_counts()) dft = pd.DataFrame(df\_test.category.value\_counts()) pd.merge(dfp, dft, left\_index=True, right\_index=True)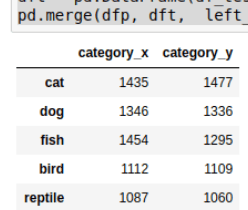
The default behavior is to show only categories that match each other and omit non-matching ones. If you need to find categories that are not present in both you can use: how='outer'.
Priority and severity of issues
For any given data quality issue, what is its severity or impact on the overall quality level of the dataset? There isn't a general rule here. What’s important here is to present a full overview of the found issues and their extent across the dataset.
For example, finding count of unique and non-unique values can be achieved using the unique and nunique methods:
- df['id'].nunique()
- df['id'].unique()
Duplicated items can be checked against several or all columns:
Plain text
Copy to clipboard
Open code in new window
EnlighterJS 3 Syntax Highlighter
df_pets[df_pets.duplicated()] df_pets[df_pets[['Owner', 'Id']].duplicated()]
df_pets[df_pets.duplicated()] df_pets[df_pets[['Owner', 'Id']].duplicated()]
1df\_pets\[df\_pets.duplicated()\] df\_pets\[df\_pets\[\['Owner', 'Id'\]\].duplicated()\]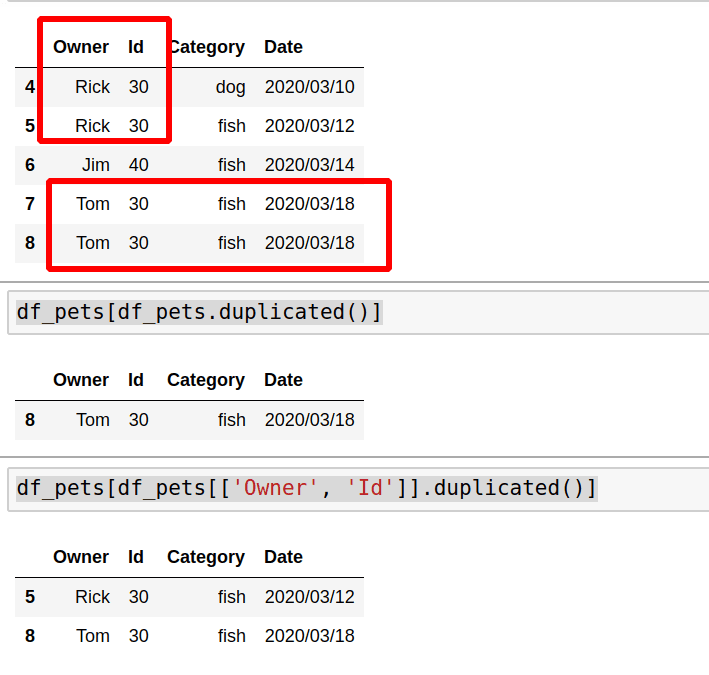
If you want to display the number of impacted items you can use shape or value_counts. In the next example we can see how to use value_counts with percentage:
Plain text
Copy to clipboard
Open code in new window
EnlighterJS 3 Syntax Highlighter
counts = df_prod.category.value_counts() percent = df_prod.category.value_counts(normalize=True).mul(100).round(1).astype(str) + ' %' pd.DataFrame({'counts': counts, 'percent': percent})
counts = df_prod.category.value_counts() percent = df_prod.category.value_counts(normalize=True).mul(100).round(1).astype(str) + ' %' pd.DataFrame({'counts': counts, 'percent': percent})
1counts = df\_prod.category.value\_counts() percent = df\_prod.category.value\_counts(normalize=True).mul(100).round(1).astype(str) + ' %' pd.DataFrame({'counts': counts, 'percent': percent})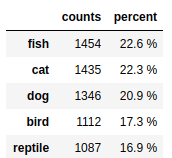
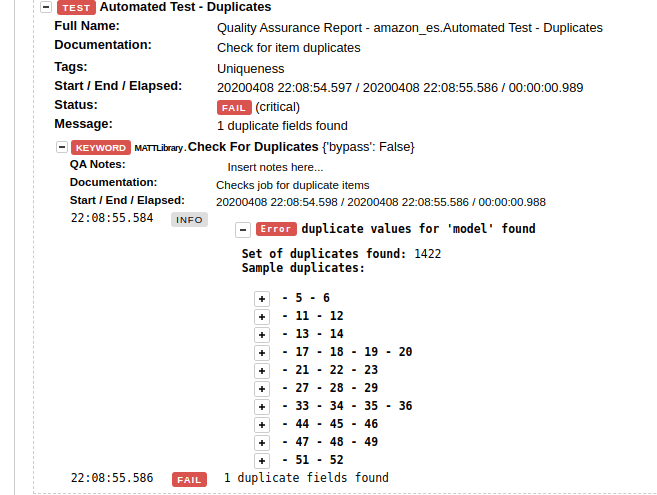
When such queries are combined with a test automation framework like Robot, we get well-formatted, actionable validation results.
Testing for completeness
For well-designed and simple websites with a relatively low number of scrapeable records, verification of completeness (i.e. did we scrape all the items that could be conceivably scraped?) can be straightforward, particularly when the website provides category counts. It gets considerably more complex under the following conditions:
- Huge (into the millions) product catalogues
- “Infinite scrolling” pages
- Absence of pagination
Often, this completeness verification (also known as “item coverage QA”) cannot be automated, at least not fully. Where possible, one should take advantage of the categorization that the website’s catalog is built around, then use relevant data points to provide indicators as to possible incompleteness.
- Select a good categorical field - like category, type, breadcrumb etc
- Check data with value_counts
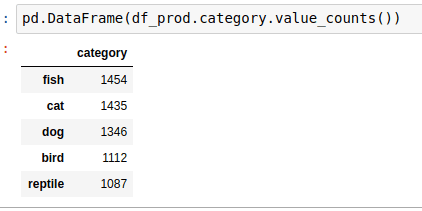
Next steps:
- Select a category with a small number of items that can be verified easily.
- Test all items from this category against the real data on the website. (This step could be repeated several times with different categories)
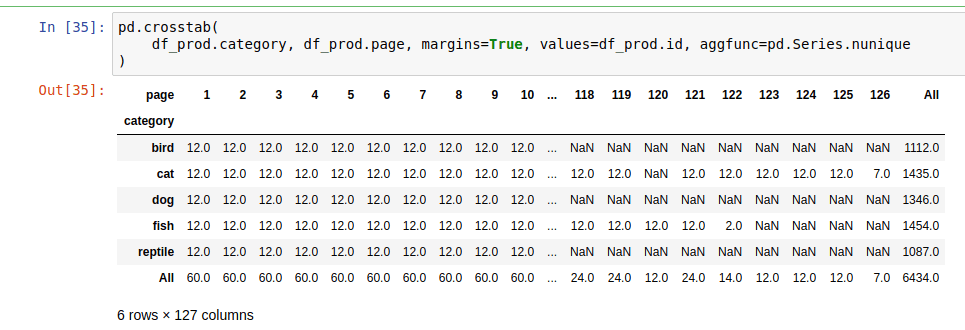
- Additionally, if the data contains data points such as pages, item numbers, etc... then Pandas can be used with a pivot table or cross tables thus:
Plain text
Copy to clipboard
Open code in new window
EnlighterJS 3 Syntax Highlighter
pd.crosstab( df_prod.category, df_prod.page, margins=True, values=df_prod.id, aggfunc=pd.Series.nunique )
pd.crosstab( df_prod.category, df_prod.page, margins=True, values=df_prod.id, aggfunc=pd.Series.nunique )
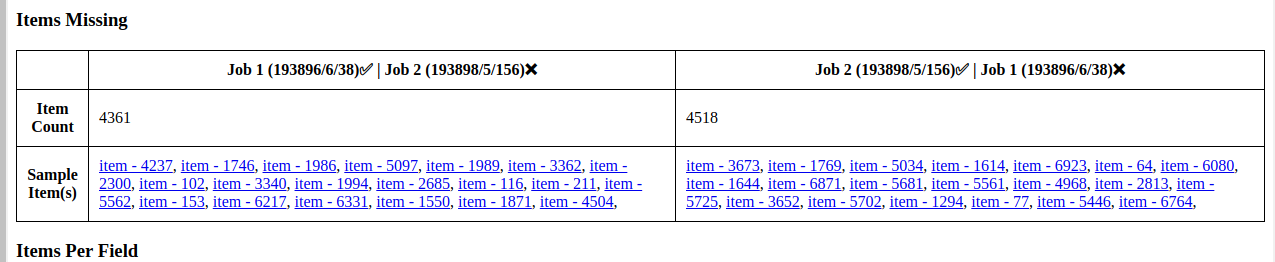
1pd.crosstab( df\_prod.category, df\_prod.page, margins=True, values=df\_prod.id, aggfunc=pd.Series.nunique )This code will show us the distribution of two fields against each other. Several conclusions can be drawn from this table:
- Incomplete data
- In the case of pages - if page 1 has 5 items but page 2 has 12 items it means that page 1 might have missing data
- There is data for page 1 and 3 but items are missing from page 2
- Are there any outliers?
- Pages with high numbers
- Duplication
- If a given page contains twice (or more than twice) the number of items than other pages
When is the quality good enough?
While this post has covered some advanced data-wrangling techniques as they are part of data QA, nothing can take the place of the QA Engineer’s experience in order to decide when the data is of acceptable quality or not. In the next post, we’ll discuss examples of how automated and manual data QA techniques can be combined to cover all bases and allow the QA Engineer to draw a line under testing and either say “QA Passed” or “more work needed”.
Want to learn more about web data quality assurance? Check out part 3, part 4, and part 5 of the series.
Do you need web data?
If you are in need of web data, we know quality is important for you. Over the years, we’ve developed a truly unique and first-rate Quality Assurance methodology that ensures timely and uncompromised data quality and coverage.
If you have an upcoming web data project and you’re looking for a reliable data partner, have a look at our Solutions or Contact us to discover how we can help you get web data!


_HFpro5d6k3.png&w=256&q=75)
_E4PyVpfAxa.png&w=256&q=75)


-(1).png&w=1920&q=75)
-(1)_VZGHqxCgXV.png&w=1920&q=75)
